Excel lets you easily create simple data tables that show how changing a formula input affects the formula result. You can, for example, build simple one-variable data tables that show how changing a single input value affects one or more formulas. And you can also create more com- plicated two-variable data that show how changing two input values affect a single formula.
Working with One-Variable Data Tables
One-variable data tables let you experiment with how changing a single input variable can affect a formula’s result or even several formulas’ results. For example, suppose that you wanted to see how a changing interest rate would affect the loan payment on a $100,000 mortgage. Or suppose that you wanted to see how a changing interest rate would affect the loan payments on a $100,000 mortgage with two different repayment terms: repayment over 15 years and repayment over 30 years. Within Excel, the easiest way to make these calcu- lations would be with a one-variable data table. Both what-if analyses look at the effect of a single changing input value, the interest rate, on a formula or formulas.
Setting Up a One-Variable Data Table
To set up a one-variable data table, you arrange the input values along either the left or top edge of a worksheet range and the formula or formulas you want to calculate along the other edge (top or left). Figure 6-1 shows how this looks with the input values—8%, 9%, 10%, 11%, and 12%—stored along the left edge of the worksheet range in A2:A6. Along the other edge of the worksheet range—in Figure 6-1, this means B1:C1—enter the formulas you want to test using the input values. In Figure 6-1, I entered two formulas for calculating the monthly mortgage payment.
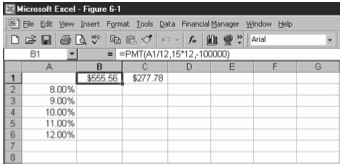
Cell B1 holds the formula shown below to calculate the monthly payment on a 15-year, $100,000 mortgage:
=PMT(A1/12,15*12,-100000)
Cell C1 holds the formula shown below to calculate the monthly payment on a 30-year, $100,000 mortgage:
=PMT(A1/12,30*12,-100000)
The key point to note about both of these formulas—this is the secret to using a one-variable data table—is that they refer to the empty corner cell of the worksheet that holds the data table.
Once you’ve arranged the input values and the formulas as shown in Figure 6-1, finish the data table by following these steps:
- Select the worksheet range that includes the input values and the formulas.
In Figure 6-1, this means you select the worksheet range A1:C6. - Choose the Data menu’s Table command.
When you do, Excel displays the Table dialog box shown in Figure 6-2.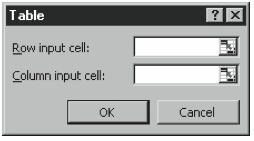
Figure 6-2. The Table dialog box. - Provide the input cell location.
The input cell location tells Excel which cell address you’ve referenced in your what-if formulas. In the worksheet shown in Figure 6-1, the two what-if formulas use cell A1 as the changing, interest-rate input value. So this is the input cell. Because Figure 6-1 arranges the input values into a column, you enter this cell address in the Column Input Cell text box, as shown in Figure 6-2. - Click OK.
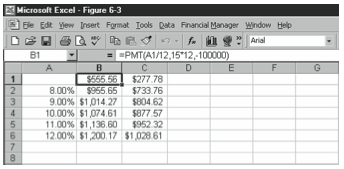
Excel fills the data table with formula results for each input value, as shown in Figure 6-3. For example, Excel fills cell B2 by using the formula in cell B1 and the interest rate in cell A2 to calculate the monthly payment on a 15-year, $100,000 mortgage when the annual interest rate is 8%. Excel fills cell C3 by using the formula in cell C1 and the interest rate in cell A3 to calculate the monthly payment on a 30-year, $100,000 mort- gage when the annual interest rate is 9%. - Enter a value for alpha.
Alpha gives the significance level related to the probability of rejecting a true hypothesis. - Specify where you want to place the ANOVA table.
Figure 4-15 shows an ANOVA table beneath production sample data from three plants.
Using the One-Variable Data Table
After you set up the one-variable data table, you can continue your what-if analysis with- out having to use the Data menu’s Table command. Simply change the input values, and Excel updates the formula results for your changes. In the worksheet shown in Figure 6-3, for example, to see what loan payments would look like on a 15-year and 30-year, $100,000 mortgage at 6.5%, 7%, 7.5%, 8%, and 8.5%, enter these interest rate values in the worksheet range A2:A6.
While you might expect to have to reuse the Data menu’s Table command to get Excel to recalculate the what-if formulas, you don’t actually have to do this. When you initially choose the Data menu’s Table command, Excel places the following formula in each of the cells inside the data table:
={TABLE(,A1)}
If you change an input value, Excel recalculates the TABLE function using the new input value.
Working with Two-Variable Data Tables
Two-variable data tables let you experiment with how changing two input variables can affect a single formula’s result. For example, suppose that you wanted to see how a changing in- terest rate would affect the loan payment on 30-year mortgages of various sizes. For example, suppose that you wanted to calculate a loan payment using interest rates of 8%, 9%, 10%, 11%, and 12% and on mortgage amounts of $100,000, $200,000, and $300,000. Within Excel, the easiest way to make these calculations would be with a two-variable data table.
Setting Up a Two-Variable Data Table
To set up a two-variable data table, you arrange the two sets of input values along the left and top edge of a worksheet range. You then place the what-if formula in the top-left cor- ner cell of the worksheet range. Figure 6-4 shows how this looks with the interest rate in- put values—8%, 9%, 10%, 11%, and 12%—stored along the left edge of the worksheet range in A2:A6 and the mortgage balance input values stored along the top edge of the worksheet range in B1:D1.
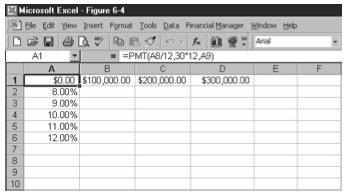
Cell A1 holds the formula shown below to calculate the monthly payment on a 30-year mortgage:
=PMT(A8/12,30*12,A9)
The key point to note about this formula—and this is the secret to using a two-variable data table—is that the formula refers to two empty cells below the worksheet range, A8 and A9, that will be used to store the what-if data.
Once you’ve arranged the input values and the formula as shown in Figure 6-4, finish the data table by following these steps:
- Select the worksheet range that includes the input values.
In Figure 6-4, this means you select the worksheet range A1:D6. - Choose the Data menu’s Table command.
When you do, Excel displays the Table dialog box shown in Figure 6-5.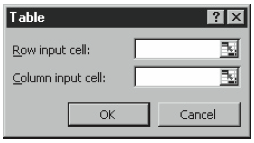
Figure 6-5. The Table dialog box. - Provide the input cell location for the input values you’ve stored in a row.
You provide the input cell location for the input values you’ve stored in a row by click- ing the Row Input Cell text box (to select the text box) and then clicking the empty cell you’ve used to refer to the variable that should be stored in this cell. Figure 6-4 stores mortgage amounts in a row, so you click the cell that the what-if formula uses to refer to the mortgage balance, which is cell A9. - Provide the input cell location for the input values you’ve stored in a column.
You provide the input cell location for the input values you’ve stored in a column by click- ing the Column Input Cell text box (to select the text box) and then clicking the empty cell you’ve used to refer to the variable that should be stored in this cell. Figure 6-4 stores interest rates in a row, so you click the cell that the what-if formula uses to refer to the interest rates, which is cell A8. - Click OK.
Excel fills the data table with formula results for each input value, as shown in Figure 6-6. For example, Excel fills cell B2 by using the formula in cell B1 and the interest rate in cell A2 to calculate the monthly payment on a $100,000 mortgage when the annual interest rate is 8%. Excel fills cell C3 by using the formula in cell C1 and the interest rate in cell A3 to calculate the monthly payment on a $200,000 mortgage when the annual interest rate is 9%. Excel fills cell D4 by using the formula in cell D1 and the interest rate in cell A4 to calculate the monthly payment on a $300,000 mortgage when the annual interest rate is 10%.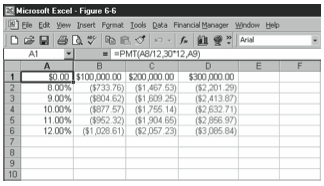
Figure 6-6. The data table after you calculate the what-if formula for each of the input values.
Using the Two-Variable Data Table
As with a one-variable data table, you can continue your what-if analysis even after you’ve set up the two-variable data table—but without having to use the Data menu’s Table com- mand. Simply change the input values, and Excel updates the formula results for your changes. In the worksheet shown in Figure 6-6, for example, to see what loan payments would be using the same interest rates but with mortgage balances equal to $125,000, $150,000, and $175,000, simply enter these values in the worksheet range B1:D1.
Leave a Reply