You can use the profit volume and break-even analysis starter workbook (PROFITVOL), shown in Figures 11-1 through 11-4, to test the effect of changing revenues on business profits. To complete the schedule, you define the following:
- Revenue variables, including the unit sales price, the low revenue in unit volume tested, and the high revenue in unit volume tested.
- Variable costs best expressed as an amount per unit, including the direct labor, the di- rect materials, and the factory overhead.
- Variable costs best expressed as a percentage of revenue, including sales commissions and sales tax.
- Any costs commonly calculated as a percentage of profits, including state income tax and federal income tax.
The starter workbook (see Figure 11-1) calculates the break-even point in units; shows the revenues, costs, and profits for the break-even point; and calculates the revenues, costs, and profits for the low units volume, the high units volume, and four intervals between the low and high volumes.
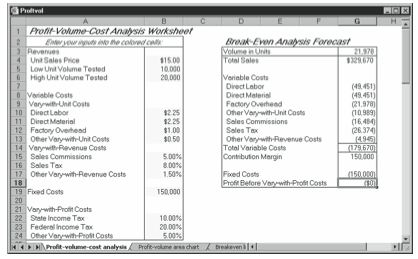
Two charts included with the starter workbook let you look at the results of your profit volume analysis graphically. The first chart shows the revenues, costs, and profits at vari- ous revenue levels. The second shows the revenues plotted against the total fixed and vari- able costs; the point at which the revenue line intersects the total fixed and variable costs identifies the break-even point.
To enter your own data in the profit volume and break-even analysis starter workbook, follow these steps:
- Open the profit volume and break-even analysis starter workbook, PROFTVOL, from the companion CD.
The workbook initially contains the default inputs shown in Figure 11-1. - Estimate the unit sales price of the product or service you sell.
In cell B4, enter the Unit Sales Price value as the amount per unit you will receive from the sales of the product or service for which you are performing profit volume and break- even analysis. - Estimate the lowest business volume in units for which you want to calculate total sales, costs, and profits.
You enter this value in cell B5. Low Unit Volume Tested is the minimum revenue level (in units) for which you will calculate revenues, costs, and profits - Estimate the highest business volume in units for which you want to calculate total sales, costs, and profits.
You enter this value in cell B6. High Unit Volume Tested is the maximum revenue level (in units) for which you will calculate revenues, costs, and profits. - Estimate any direct labor costs that vary with the units sold and that are calculated as an amount per unit.
Enter this value in cell B10. Direct Labor is the dollar amount of labor per unit. - Estimate any factory overhead costs that vary with the units sold and that are calculated as an amount per unit.
Enter this value in cell B12. Factory Overhead is the dollar amount of factory overhead per unit. - Estimate any other costs that vary with the units sold and that are calculated as an amount per unit.
If you have other costs that you want to express as a dollar amount per unit, enter the dollar amount of these other costs as the Other Vary-with-Unit Costs amount in cell B13. - Estimate any sales commissions as a percentage of the price or the total sales.
Enter this value as a percentage in cell B15. - Estimate any sales tax as a percentage of the unit sales price or the total sales.
Enter this value as a percentage in cell B16. - Estimate any other costs that vary with revenues as a percentage of the unit sales price or the total sales.
If you have other costs that you want to express as a percentage of revenues, enter that percentage as the Other Vary-with-Revenue Costs amount in cell B17. - Estimate the total fixed cost.
Enter the fixed cost value in cell B19. Fixed Costs are those costs that will not change, given the range of revenue levels for which you are testing. - Estimate the state income tax as a percentage of profits before federal income tax and other costs that vary with profits.
Enter this value in cell B22. The workbook assumes that state income taxes are a per- centage of your profits before federal income taxes and any other costs that vary with profits (such as profit-sharing plans). - Estimate the federal income tax as a percentage of profits before state income tax and other costs that vary with profits.
Enter this value in cell B23. The workbook assumes that federal income taxes are a per- centage of your profits before state income taxes and other costs that vary with profits (such as profit-sharing plans). - Estimate as a percentage any other costs that vary with the profits before taxes.
If you have other costs that you want to express as a percentage of profits, enter that percentage as the Other Vary-with-Profit Costs amount in cell B24.
Leave a Reply