The profit volume and break-even analysis starter workbook has six parts: the Profit Vol- ume Inputs box and the Break-Even Analysis Forecast (shown in Figure 11-1), the Profit Volume Forecast (shown in Figure 11-2), the Common Size Profit Volume Forecast (shown in Figure 11-3), and the Profit Volume Area and the Break-Even Analysis Line Chart Data (shown in Figure 11-4).
For convenience and good documentation within the model, cell B4 contains the Unit Sales Price amount and is named Unit_Sales_Price, cell B5 contains the Low Unit Volume Tested amount and is named Low_Unit_Volume_Tested, cell B6 contains the High Unit Volume Tested amount and is named High_Unit_Volume_Tested, cell B10 contains the Direct Labor amount and is named Direct_Labor, cell B11 contains the Direct Material amount and is named Direct_Material, cell B12 contains the factory overhead amount and is named Factory_Overhead, cell B13 contains the Other Vary-with-Units Costs amount and is named Other_Vary_Unit_Costs, cell B15 contains the Sales Commissions percentage and is named Sales_Commissions, cell B16 contains the Sales Tax percentage and is named Sales_Tax, cell B17 contains the Other Vary-with-Revenue Costs percentage and is named Other_Vary_Revenue_Costs, cell B19 contains the Fixed Costs amount and is named Fixed_Costs, cell B22 contains the State Income Tax percentage and is named State_Income_Tax, cell B23 contains the Federal Income Tax percentage and is named Federal_Income_Tax, and cell B24 contains the Other Vary-with-Profit Costs per- centageandisnamedOther_Vary_Profit_Costs.Theformulaswithinthestarterworkbook use these cell names rather than the cell addresses.
Break-Even Analysis Forecast
The Break-Even Analysis Forecast calculates the volume level in units at which you break even and displays the revenues, variable costs, and fixed costs forecasted at this volume level (see Figure 11-1). The schedule has only one column containing calculated data. Within it, revenues appear as positive amounts, and expenses appear as negative amounts.
Volume in Units
The Volume in Units amount is the number of units at which the break-even point occurs. The amount is rounded to the nearest whole unit, because selling partial units usually is impossible. This Volume in Units amount is calculated by dividing the Fixed Costs amount by the contribution margin per unit. The contribution margin per unit is calculated by sub- tracting each of the variable costs (expressed as an amount per unit) from the Unit Sales Price value. Those variable costs, which you enter as a percentage of the Unit Sales Price amount, are converted to an amount per unit. Because the calculated revenue level is the level at which no profits are generated, no costs based on profits are included in the for- mula or are shown in the forecast of revenues and costs and the break-even point. The formula for the break-even point in units (in cell G3) is:
=ROUND(Fixed_Costs/(Unit_Sales_Price- (Direct_Labor+Direct_Material+Factory_Overhead+Other_Vary_Unit_Costs)- (Unit_Sales_Price*(Sales_Commissions_+Sales_Taxes+Other_Vary_Revenue_Costs))),0)
which is essentially the break-even point equation from the EasyRefresherTM section, where:
Break-even point in units=Fixed costs/Contribution margin per unit
Total Sales
The Total Sales amount shows the revenue in dollars for the break-even point. The Total Sales amount is the break-even Volume in Units times the Unit Sales Price value. The Total Sales formula (in cell G4) is:
=G3*Unit_Sales_Price
Direct Labor
The Direct Labor figure shows the direct labor costs for the break-even volume. The amount is the break-even Volume in Units amount times the Direct Labor cost per unit. The Di- rect Labor formula (in cell G7) is:
=-G3*Direct_Labor
Direct Material
The Direct Material figure shows the direct material costs for the break-even volume. The amount is the break-even Volume in Units amount times the Direct Material cost per unit. The Direct Material formula (in cell G8) is:
=-G3*Direct_Material
Factory Overhead
The Factory Overhead figure shows the factory overhead costs for the break-even volume. The amount is the break-even Volume in Units amount times the Factory Overhead cost per unit. The Factory Overhead formula (in cell G9) is:
=-G3*Factory_Overhead
Other Vary-with-Unit Costs
The Other Vary-with-Unit Costs figure shows any other costs you have expressed as an amount per unit for the break-even volume. The amount is the break-even Volume in Units amount times the Other Vary-with-Unit Costs per unit. The Other Vary-with-Unit Costs formula (in cell G10) is:
=-G3*Other_Vary_Unit_Costs
Sales Commissions
The Sales Commissions figure shows the sales commissions costs for the break-even vol- ume. The amount is the break-even revenue level times the Sales Commissions percent- age. The Sales Commissions formula (in cell G11) is:
=-G4*Sales_Commissions
Sales Tax
The Sales Tax figure shows the sales tax costs for the break-even volume. The amount is the break-even revenue level times the Sales Tax percentage. The Sales Tax formula (in cell G12) is:
=-G4*Sales_Tax
Other Vary-with-Revenue Costs
The Other Vary-with-Revenue Costs figure shows any other costs you have expressed as a percentage of revenues for the break-even volume. The amount is the break-even revenue level times the Other Vary-with-Revenue Costs percentage. The Other Vary-with-Revenue Costs formula (in cell G13) is:
=-G4*Other_Vary_Revenue_Costs
Total Variable Costs
The Total Variable Costs figure shows the total variable costs for the break-even volume. The Total Variable Costs formula (in cell G14) is:
=SUM(G7:G13)
Contribution Margin
The Contribution Margin figure shows the difference between the total sales and the total variable costs. For break-even analysis, this amount must equal the fixed costs. However, because the break-even point in unit volume is rounded to an integer, this amount might differ. The formula (in cell G15) is:
=G4+G14
Fixed Costs
The Fixed Costs figure shows the fixed costs at the break-even volume. The formula (in cell G17) is:
=-Fixed_Costs
Profit Before Vary-with-Profit Costs
The Profit Before Vary-with-Profit Costs figure shows the amount of profit for the break- even volume and is the Contribution Margin amount minus the Fixed Costs figure. None of the costs that vary with profits are included, because profits must equal 0. In some situ- ations, the profit will equal some amount other than 0, even though, by definition, the true break-even point is the revenue volume at which profits equal 0. Typically, however, firms cannot sell fractional units of products or services. Accordingly, the break-even Volume in Units is rounded to an integer, and the starter workbook assumes that this is the closest to a break-even volume that you can actually operate. The Profit Before Vary-with-Profit Costs formula (in cell G18) is:
=G15+G17
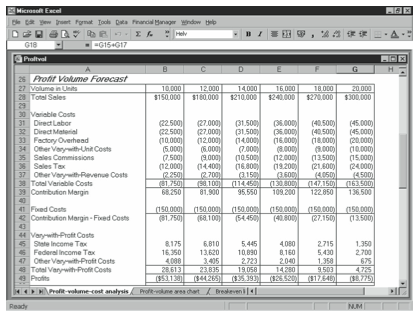
Profit Volume Forecast
The Profit Volume Forecast shown in Figure 11-2 calculates the revenue, costs, and prof- its at the low unit volume you specify, the high unit volume you specify, and four interme- diate volumes between these two boundaries. In the forecast, revenues appear as positive amounts and expenses appear as negative amounts.
Volume in Units
The Volume in Units figure shows the business volume in units for each of the six volume levelsforwhichrevenues,costs,andprofitsarecalculated.ThefirstVolumeinUnitsamount is pulled into the Profit Volume Forecast as the Low Unit Volume Tested amount you en- ter in the Profit Volume Inputs box. The second through the sixth Volume in Units amounts, however, are calculated as the previous Volume in Units amounts plus an increase equal to the range of volumes tested, divided by the number of volumes tested. The range of vol- umes tested is the High Unit Volume Tested figure minus the Low Unit Volume Tested figure. The number of volumes tested is set at 5 and is defined with the reference name Increments within the starter workbook. The formula for the second Volume in Units fig- ure (in cell C27) is:
=B27+((High_Unit_Volume_Tested-Low_Unit_Volume_Tested)/Increments)
The formula for the third volume is:
=C27+((High_Unit_Volume_Tested-Low_Unit_Volume_Tested)/Increments)
and so on.
Total Sales
TheTotalSalesamountshowstherevenueindollarsforeachvolumetested.TheTotalSales figure is the Volume in Units figure times the Unit Sales Price figure. For example, the Total Sales formula for the first volume tested (in cell B28) is:
=B27*Unit_Sales_Price
The formula for the second volume tested is:
=C27*Unit_Sales_Price
and so on.
Direct Labor
The Direct Labor figure shows the direct labor costs for each of the volumes tested. The amount is the Volume in Units figure times the Direct Labor cost per unit. The Direct Labor formula for the first volume (in cell B31) is:
=-B27*Direct_Labor
The formula for the second volume is:
=-C27*Direct_Labor
and so on.
Direct Material
The Direct Material figure shows the direct material costs for each of the volumes. The amount is the Volume in Units figure times the Direct Material cost per unit. The Direct Material formula for the first volume (in cell B32) is:
=-B27*Direct_Material
The formula for the second volume is:
=-C27*Direct_Material
and so on.
Factory Overhead
The Factory Overhead figure shows the factory overhead costs for each of the volumes. The amount is the Volume in Units figure times the Factory Overhead cost per unit. The Fac- tory Overhead formula for the first volume (in cell B33) is:
=-B27*Factory_Overhead
The formula for the second volume is:
=-C27*Factory_Overhead
and so on.
Other Vary-with-Unit Costs
The Other Vary-with-Unit Costs figure shows any other costs you have expressed as an amount per unit for each volume tested. The amount is the Volume in Units figure times the Other Vary-with-Unit Costs per unit. The other Vary-with-Unit Costs formula (in cell B34) is:
=-B27*Other_Vary_Unit_Costs
The formula for the second volume is:
=-C27*Other_Vary_Unit_Costs
and so on.
Sales Commissions
The Sales Commissions figure shows the sales commissions costs for each of the volumes tested. The amount is the Total Sales figure times the Sales Commissions percentage. The Sales Commissions formula for the first volume (in cell B35) is:
=-B28*Sales_Commissions
The formula for the second volume is:
=-C28*Sales_Commissions
and so on.
Sales Tax
The Sales Tax figure shows the sales tax costs for each of the volumes tested. The amount is the Total Sales figure times the Sales Tax percentage. The Sales Tax formula for the first volume (in cell B36) is:
=-B28*Sales_Tax
The formula for the second volume is:
=-C28*Sales_Tax
and so on.
Other Vary-with-Revenue Costs
The Other Vary-with-Revenue Costs figure shows any other costs you have expressed as a percentage of revenues for each of the volumes tested. The amount is the Total Sales fig- ure times the Other Vary-with-Revenue Costs percentage. The Other Vary-with-Revenue Costs formula for the first volume (in cell B37) is:
=-B28*Other_Vary_Revenue_Costs
The formula for the second volume is:
=-C28*Other_Vary_Revenue_Costs
and so on.
Total Variable Costs
The Total Variable Costs figure shows the total variable costs for each of the volumes tested. The Total Variable Costs formula for the first volume (in cell B38) is:
=SUM(B31:B37)
The formula for the second volume is:
=SUM(C31:C37)
and so on.
Contribution Margin
The Contribution Margin figure shows the difference between the Total Sales figure and the Total Variable Costs figure. The Contribution Margin formula for the first volume (in cell B39) is:
=B28+B38
The formula for the second volume is:
=C28+C38
and so on.
Fixed Costs
This figure is the Contribution Margin figure minus the Fixed Costs figure. It is the amount used to calculate any costs that vary with profits. The Contribution Margin – Fixed Costs formula for the first volume (in cell B42) is:
=B39+B41
The formula for the second volume is:
=C39+C41
and so on.
State Income Tax
The State Income Tax figure shows the state income tax costs for each of the volumes tested. The amount is the Contribution Margin – Fixed Costs figure times the State Income Tax percentage. The State Income Tax formula for the first volume (in cell B45) is:
=-B42*State_Income_Tax
The formula for the second volume is:
=-C42*State_Income_Tax
and so on.
Federal Income Tax
The Federal Income Tax figure shows the federal income tax costs for each of the volumes tested. The amount is the Contribution Margin – Fixed Costs figure times the Federal In- come Tax percentage. The Federal Income Tax formula for the first volume (in cell B46) is:
=-B42*Federal_Income_Tax
The formula for the second volume is:
=-C42*Federal_Income_Tax
and so on.
Other Vary-with-Profit Costs
The Other Vary-with-Profit Costs figure shows any other costs that are calculated as a percentage of profits for each of the volumes tested. The amount is the Contribution Margin – Fixed Costs figure times the Other Vary-with-Profit Costs percentage. The Other Vary- with-Profit Costs formula for the first volume (in cell B47) is:
=-B42*Other_Vary_Profit_Costs
The formula for the second volume is:
=-C42*Other_Vary_Profit_Costs
and so on.
Total Vary-with-Profit Costs
The Total Vary-with-Profit Costs figure shows the total of the costs that vary with profits for each of the volumes tested. The formula for the first volume (in cell B48) is:
=SUM(B45:B47)
The formula for the second volume is:
=SUM(C45:C47)
and so on.
Profits
The Profits figure shows the profits for each of the volumes tested and is the Contribution Margin – Fixed Costs amount minus the Total Vary-with-Profit Costs amount. The Prof- its formula for the first volume (in cell B49) is:
=B42+B48
The formula for profits for the second volume is:
=C42+C48
and so on.
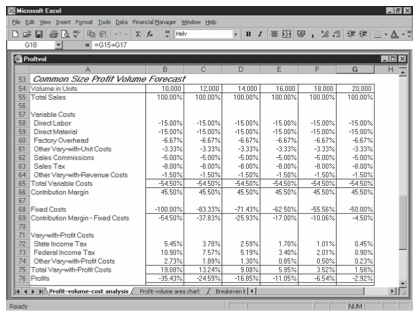
Common Size Profit Volume Forecast
The Common Size Profit Volume Forecast (shown in Figure 11-3) simply converts the costs and profits in the Profit Volume Forecast to percentages of the total sales for each of the volumes for which revenue, costs, and profits are calculated.
Predictably, the formulas used in this forecast are all very simple. For example, the formula for the Total Sales percentage for the first volume shown (in cell B55) is:
=B28/B$28
The Volume in Units formulas are simply cell references to the Volume in Units figures cal- culated in the Break-Even Analysis Forecast. For example, the Volume in Units formula for the first volume shown (in cell B54) is:
=B27
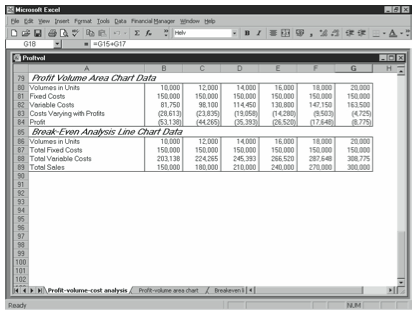
Interpreting the Profit Volume Charts and Chart Data
The Profit Volume Area Chart Data (shown in Figure 11-4) provides the data graphed in the profit volume area chart discussed later in the chapter.
All the figures are simply pulled from the Profit Volume Forecast by cell references. For example, the Volume in Units figure for the first volume is pulled from the Profit Volume Forecast by the following formula:
=B27
The Fixed Costs, Variable Costs, and Costs Varying with Profits figures are pulled as positive numbers from the Profit Volume Forecast, in which they appear as negative numbers. For example, the formula for the first volume of the Fixed Costs row is:
=-B41
The Break-Even Analysis Line Chart Data (also shown in Figure 11-4) provides the data to the line chart discussed later in the chapter, which identifies the break-even point by show- ing the intersection of the total sales line with total costs line. The Volume in Units, Total Fixed Costs, and Total Sales figures are pulled from the Profit Volume Forecast by cell references. For example, the formula for the first volume of the Volume in Units row is:
=B27
The Fixed Costs figure is pulled as a positive number from the Profit Volume Forecast, in which it appears as a negative number. For example, the formula for the first volume is:
=-B41
The Total Variable Costs figure includes those costs that vary with profits. The figure is the sum of the Fixed Costs, the Total Variable Costs, and the Total Vary-with-Profit Costs figures calculated in the Profit Volume Forecast. Fixed costs are included because the line chart plots total cost data against fixed cost data. You see the difference between the two lines, or the total variable costs. The formula for the first volume is:
=-B38-B41-B48
Leave a Reply