• Skip to primary navigation
  • Skip to main content
  • Skip to primary sidebar

Stephen L. Nelson

Author. Accountant. Aspiring Apiarist.

  • Articles
  • e-Books
    • Maximizing Section 199A Deduction
    • Setting a a Reasonable S Corporation Salary
    • Small Business Tax Deduction Secrets
    • Real Estate Tax Loopholes & Secrets
    • DIY LLC Formation and Incorporation Kits
    • Sample LLC Operating Agreements
    • Sample Corporation By-Laws
  • Contact

Charting Profit Volume Analysis Data

May 18, 2015 By Stephen L. Nelson Leave a Comment

Two charts are included with the starter workbook let you look at the results of your profit volume analysis graphically. The first chart shows the revenues, costs, and profits at various revenue levels. The second shows the revenues plotted against the total fixed and variable costs; the point at which the revenue line intersects the total fixed and variable costs identifies the break-even point.

Using the Profit Volume Area Chart

Figure 11-5 shows an area chart of the variable costs, fixed costs, costs varying with prof- its, and profits forecasted for volumes modeled in a profit volume analysis. To use the area chart for your own profit volume analysis, simply follow the instructions in the earlier section “Using the Profit Volume and Break-Even Analysis Starter Workbook” to enter inputs for the profit volume and break-even analysis starter workbook.

Figure 11-5. The profit volume area chart.

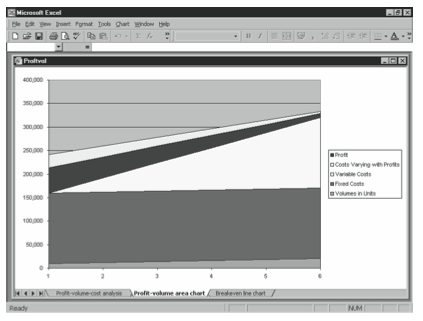
The profit volume area chart resides on the Profit-Volume Area Chart tab of the workbook. Click the Profit-Volume Area Chart sheet tab to view the chart once you’ve collected and entered the starter workbook’s input data.

Notice that although the total sales are not explicitly included in the chart, they are implicitly included because the sum of the variable costs, fixed costs, costs varying with profits, and profits add up to the total sales.

Using the Break Even Line Chart

Figure 11-6 shows a line chart of total sales plotted against total costs, including variable costs, fixed costs, and costs varying with profits. To use the line chart for your own break-even analysis, first follow the instructions in the section “Using the Profit Volume and Break-Even Analysis Starter Workbook” to enter inputs for the profit volume and break-even analysis starter workbook.

Figure 11-6. The break-even line chart.

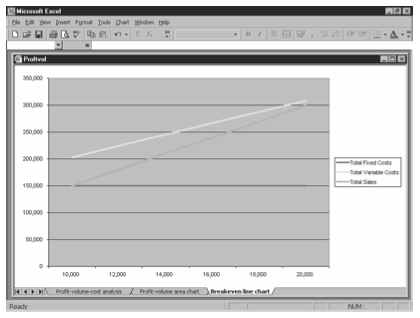
The break-even line chart resides on the Breakeven Line Chart tab of the workbook. Click the Breakeven Line Chart sheet tab to view the chart once you’ve collected and entered the starter workbook’s input data.

Because area and line charts emphasize the differences in a variable or variables over time, the scaling for the values axis greatly affects the perceived differences. By using small scaling units, you increase the perceived change in the variable or variables. By using large scaling units, you decrease the perceived change. In general, common sense suggests that the scaling units for charts of financial information be determined by the materiality of the changes. This means that you might need to override the automatic scaling provided by Excel because it scales the data based on the minimum and maximum values, not on your subjective definition of materiality.

Filed Under: Finance, Using Excel Tagged With: profit volume analysis

About Stephen L. Nelson

Stephen L. Nelson is the author of more than two dozen best-selling books, including Quicken for Dummies and QuickBooks for Dummies.

Nelson is a certified public accountant and a member of both the Washington Society of CPAs and the American Institute of CPAs. He holds a Bachelor of Science in Accounting, Magna Cum Laude, from Central Washington University and a Masters in Business Administration in Finance from the University of Washington (where, curiously, he was the youngest ever person to graduate from the program).

Reader Interactions

Leave a Reply Cancel reply

Your email address will not be published. Required fields are marked *

This site uses Akismet to reduce spam. Learn how your comment data is processed.

Primary Sidebar

Article Categories

  • Accounting
  • Business Planning
  • Finance
  • Real Estate
  • Statistics
  • Taxes
  • Using Excel

Copyright © 2025 Stephen L. Nelson, Inc. · Contact · Steve’s Bio · Publications · Glossary