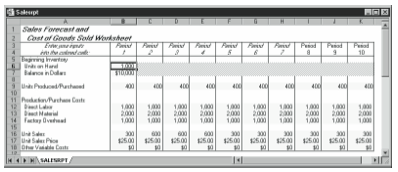
You can use the sales forecasting starter workbook, as shown in Figures 12-1 and 12-2, to construct sales forecast schedules for each product or service for which you want to estimate sales and production activity separately. This starter workbook provides a framework for the development of your own sales forecasts. To complete it for a product or service line, you develop and then enter your sales forecasts, your manufacturing or purchasing forecasts, and your beginning inventory levels for work in process and finished goods.
Given the beginning inventory (expressed both in units and in dollars), the number of units produced or purchased and their costs by period, and the sales volumes and unit sales prices by period, this workbook details and calculates the total sales, production activity, and inventory balances by period on the forecasting horizon. You need this information to calculate product sales and gross margins, business profits and losses, and business cash flows, and you need it to report the inventory balance on the balance sheet.
To enter your own data in sales forecasting starter workbook, follow these steps:
- Open the sales forecasting starter workbook, SALESRPT.XLS, from the companion CD.
The workbook initially contains the default inputs shown in Figure 12-1.
Figure 12-1. The inputs area of the sales forecasting starter workbook. - Enter the beginning inventory balance in dollars and in units on hand for the first period.
The values you enter for Units on Hand and Balance in Dollars under Beginning Inventory come from your accounting records; they document your starting inventory balances. Notice that subsequent periods’ beginning inventory figures are calculated, not entered, using the forecasts of sales and manufacturing or purchasing activity. - Enter the units produced or purchased for each period over the forecasting horizon.
The period production figures stem from your forecasts of the anticipated manufacturing or the anticipated purchasing volumes necessary to support the sales plan. Note: For manufacturing firms, the number of units in the starting inventory balance and the number of units produced should be expressed in equivalent units. For example, 100 units that are 50% complete are included in the schedule instead as 50 units that are 100% complete. This approach is necessary because if you don’t use equivalent units, only a percentage of the costs are included and the calculated unit cost will be too low. - Enter the production costs (direct labor, direct material, and factory overhead) associated with manufacturing or purchasing volumes forecasted for each period over the forecasting horizon.
The production costs—Direct Labor, Direct Material, and Factory Overhead—are those costs associated with manufacturing or purchasing the product. If you are in a wholesale or retail business that has no manufacturing activity, enter only the Direct Material value (which should be called purchases). - Enter the units sold and the unit sales price forecasted for each period over the forecasting horizon.
Forecast the units sold and the unit sales price based on your sales and marketing research. In general, you estimate future sales based on your past sales history and expectations about future orders. - Enter any other variable costs associated with consummating a sale for each period over the forecasting horizon.
Other variable costs associated with a sale might include commissions or bonuses owed to the salespeople who close the sale, bad debt expense that might be expressed as a function of the sale, and marketing costs related to packaging and distributing the product. You’ll often enter this item as a formula that is calculated from unit sales, unit sales price, or the production/purchase costs.
Leave a Reply