The sales forecasting starter workbook has five parts: the Sales Forecast heading box, the Sales Forecast Inputs (discussed above), Cost Totals and Statistics, Sales and Gross Margin Forecast, and Inventory Forecast.
Sales Forecast Schedule
The Sales Forecast Schedule heading box provides column headings for the schedules in the starter workbook. It uses a single formula to calculate the period number. The period identifier simply numbers the time periods for which sales, manufacturing or purchasing, and inventory levels are forecasted. You’ll probably want the number of periods in your Sales Forecast Inputs schedule to correspond to the number of periods in the other schedules that make up your financial forecasting model. The first period is stored in cell B4 as the integer 1. Subsequent period numbers are calculated as 1 plus the previous period.
Cost Totals and Statistics
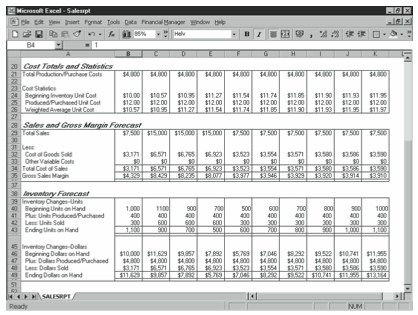
The Cost Totals and Statistics schedule calculates the total production and purchase costs, as well as the beginning, produced or purchased, and weighted average unit costs (see Figure 12-2). It has four rows that contain calculated data.
Total Production/Purchase Costs
The Total Production/Purchase Costs value is simply the sum of the Direct Labor, Direct Material, and Factory Overhead values. For a wholesaler or retailer, because the Direct Labor and Factory Overhead figures, by definition, are 0, the total cost is the same as the Direct Material cost. For a service firm, no inventory might be manufactured or purchased for resale. Therefore, this amount might be 0.
The formula for the first period is:
=B12+B13+B14
The formula for the second period is:
=C12+C13+C14
and so on.
Beginning Inventory Unit Cost
The Beginning Inventory Unit Cost value represents the cost of producing one of the units held in the beginning inventory. It is calculated by dividing the Beginning Dollars on Hand value by the Beginning Units on Hand value calculated in the Inventory Forecast schedule. For example, the formula for the first period is:
=B46/B40
The formula for the second period is:
=C46/C40
and so on.
Produced/Purchased Unit Cost
The Produced/Purchased Unit Cost value represents the cost of producing or purchasing one of the units manufactured or bought during the period. Although the inventory balances reported on this schedule use an average cost inventory assumption, you can use this value to construct alternative inventory costing methods, such as First-In-First-Out (FIFO) and Last-In-First-Out (LIFO). (FIFO assumes that the first items purchased or produced are the first items sold; LIFO assumes that the last items purchased or produced are the first items sold. In a period of rising prices, FIFO calculates lower cost of goods sold and higher ending inventory.)
The formula for the first period is:
=B21/B9
The formula for the second period is:
=C21/C9
and so on.
Weighted Average Unit Cost
The Weighted Average Unit Cost value represents the average cost of the product units, considering both the beginning inventory balance and the period production or purchase inventory. This is the per unit cost used to calculate both the cost of sales and next period’s beginning inventory levels.
The formula divides the total of the inventory Beginning Dollars on Hand and the Total Production/Purchase Costs values by the total of the inventory Beginning Units on Hand and the Units Produced/Purchased values. For example, the formula for the first period is:
=(B46+B21)/(B40+B9)
The formula for the second period is:
=(C46+C21)/(C40+C9)
and so on.
Sales and Gross Margin Forecast
The Sales and Gross Margin Forecast schedule calculates the total sales, cost of goods sold, other variable costs, total cost of sales, and gross sales margin. It has five rows of data.
Total Sales
The Total Sales figure represents the total sales made over the period. The Total Sales formula multiplies the Unit Sales value by the Unit Sales price value. For example, the first period total sales formula is:
=B16*B17
The second period total sales formula is:
=C16*C17
and so
Cost of Goods Sold
The Cost of Goods Sold figure shows the total cost of manufacturing or purchasing the items sold during the period. The formula multiplies the Unit Sales value for the period by the Weighted Average Unit Cost value for the period. For example, the formula for the first period is:
=B16*B26
The formula for the second period is:
=C16*C26
and so
Other Variable Costs
The Other Variable Costs figure shows the other direct costs associated with consummating a sale. The value is simply pulled from the cell in which you entered this figure in the Sales Forecast Inputs schedule.
Total Cost of Sales
The Total Cost of Sales figure shows the total cost of goods sold and other costs related to the sales. The value is the sum of the Cost of Goods Sold and Other Variable Costs values. For example, the formula for the first period is:
=B32+B33
The formula for the second period is:
=C32+C33
and so
Gross Sales Margin
The Gross Sales Margin figure shows the amount remaining from sale proceeds after deducting the cost of sales. The Gross Sales Margin figure represents the funds that go toward paying your fixed costs and profits. The formula is the Total Sales value less the Total Cost of Sales value. For example, the formula for the first period is:
=B29-B34
The formula for the second period is:
=C29-C34
and so
Inventory Forecast
The Inventory Forecast schedule calculates the beginning inventory balance, the change in inventory balance, and the ending inventory balance, each in dollars and in units. The schedule has eight rows that contain calculated data.
Beginning Units on Hand
The Beginning Units on Hand figure shows the number of complete products you have available for resale at the beginning of the period. For the first forecasting period, the Beginning Units on Hand figure is simply pulled from the Sales Forecast Inputs schedule. In subsequent periods, it is taken from the cell containing the previous period’s Ending Units on Hand.
Plus: Units Produced/Purchased
The Units Produced/Purchased figure shows the number of equivalent units manufactured or the number of units bought during the period. The number is pulled from the Sales Forecast Inputs schedule.
Less: Units Sold
The Units Sold figure shows the number of units in inventory sold during the period. The number is pulled from the Unit Sales forecast in the Sales Forecast Inputs schedule.
Ending Units on Hand
The Ending Units on Hand figure shows the number of units of inventory held at the end of the period. This number is always the same as the number of units held at the beginning of the next period.
The number is the Beginning Units on Hand value plus the Units Produced/Purchased value for the period minus the Units Sold value for the period. For example, the formula for the first period is:
=B40+B41-B42
The formula for the second period is:
=C40+C41-C42
and so on.
Beginning Dollars on Hand
The Beginning Dollars on Hand figure shows the dollar cost of the completed and partially completed products that you have available in inventory for resale. The number for the first period is pulled from the Sales Forecast Inputs schedule. In subsequent periods, the number is taken from the previous period’s Ending Dollars on Hand.
Plus: Dollars Produced/Purchased
The Dollars Produced/Purchased figure shows the dollar cost of the units manufactured or bought during the period, using the weighted average unit cost as the cost per unit. The number is pulled from Total Production/Purchase Costs in the Cost Totals and Statistics schedule.
Less: Dollars Sold
The Dollars Sold figure shows the dollar cost of the units sold during the period, using the weighted average unit cost as the cost per unit. This amount is pulled from Cost of Goods Sold in the Sales and Gross Margin Forecast.
Ending Dollars on Hand
The Ending Dollars on Hand figure shows the dollar cost of the inventory held at the end of the period. This number is always the same as the dollar cost of the inventory held at the beginning of the next period.
If you are in a manufacturing business, you can use this amount as the dollar cost of the work in process and finished inventory that is included in the Balance Sheet. If you are in a wholesale or retail business, you use this amount as the dollar cost of all the inventory that is included in the balance sheet.
The Ending Dollars on Hand formula adds the Beginning Dollars on Hand and Dollars Produced/Purchased values and then subtracts the Dollars Sold value. For example, the formula for the first period is:
=B46+B47-B48
The formula for the second period is:
=C46+C47-C48
and so on.
Leave a Reply