The Small Business Financial Manager provides you with four Financial Analysis Tools: Business Comparison Reports, Buy vs. Lease Analysis, a Create Projection Wizard, and What-If Analysis.
Using the Business Comparison Report Tool
The Business Comparison Report tool creates a report that lets you compare one business’s financial profile with industry averages of other businesses of a similar size in the same industry. The first page compares well-known financial ratios of the company to the industry averages. The second page of the business comparison report, an Income Statement, com- pares key income statement data—such as sales, gross margin, and profit—to the industry averages. The third page of the business comparison report, a Balance Sheet, compares key balance sheet data, including current assets and current liabilities—to industry averages.
To use the Business Comparison Report tool, follow these steps:
- Start the Business Comparison Wizard.
Click the Analyze button on the Startup Screen, and then select a Business Compari- son item from the list box in the Select A Financial Manager Analysis Tool dialog box and click Next. Excel displays the first Business Comparison Wizard dialog box (see Figure 9-6).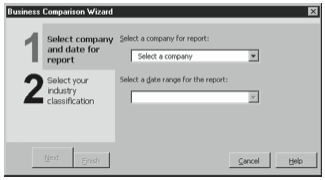
Figure 9-6. The first Business Comparison Wizard dialog box. - Select the company and the period you want to compare.
Select the company you want to compare, if necessary, from the Select A Company For Report box. Select an accounting period you want to compare from the Select A Date Range For The Report box. When you finish with this, click Next. Excel displays the second Business Comparison Wizard dialog box (see Figure 9-7).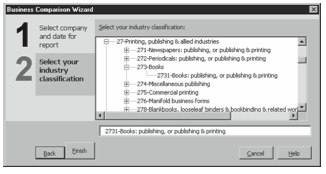
Figure 9-7. The second Business Comparison Wizard dialog box. - Select the industry in which the company operates.
The Business Comparison Wizard organizes industries into a tree diagram. To expand a tree branch, click its plus sign. To collapse a tree branch, click its minus sign. When you find the industry that most closely matches your company, click it and then click the Finish button. The Business Comparison Wizard compares your company to the industry averages, producing a report similar to the one shown in Figure 9-8.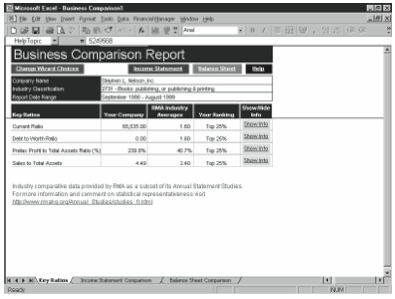
Figure 9-8. The first page of a Business Comparison report.
Although the Business Comparison tool produces thought-provoking data, unfortunately, many business users will find its information of very limited value. For one thing, the ef- fectiveness of the comparison depends to a great extent on how closely a business matches the selected industry classification. If a company truly resembles the industry into which it’s placed, the comparison may be very useful. If a company doesn’t resemble the industry, however, the comparison may be meaningless.
Another issue concerns the accounting policies and conventions used both by the company and the industry. Even large companies show considerable variety and creativity in the ac- counting policies they adopt and the conventions they follow. And one can only assume that small companies show even more variety and creativity. Differences in accounting treatment, of course, also make comparisons more difficult.
Using the Buy Vs. Lease Tool
The Buy Vs. Lease tool helps you choose between buying or leasing some asset. The Buy Vs. Lease Wizard is perhaps most useful for forecasting the cash flows that stem from an asset purchase. Predictably, the wizard suggests that you borrow to buy an asset when the cost of borrowing is less than the cost of capital. For this reason, you don’t really need to use the wizard to determine which financing option works best: the cheapest financing option is the cheapest financing option.
The Buy Vs. Lease Wizard is more useful, however, when you want to explore the effects of a purchase on your cash flows. In small companies, perhaps especially those that are grow- ing, the cash flow effect of an asset purchase becomes a major issue—sometimes one that’s more important than net present value measures.
To use the Buy Vs. Lease tool, follow these steps:
- Start the Buy Vs. Lease Wizard.
Click the Analyze button on the Startup screen, and then select a Buy Vs. Lease item from the list box in the Select A Financial Manager Analysis Tool dialog box. Excel displays the first Buy Vs. Lease Wizard dialog box (see Figure 9-9).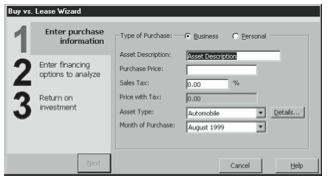
Figure 9-9. The first Buy Vs. Lease Wizard dialog box. - Describe the asset.
Use the first Buy Vs. Lease Wizard dialog box to describe the asset you may buy or lease. Use the Type Of Purchase buttons to indicate whether the asset is a business or personal asset. Use the Asset Description box to name the asset. Use the Purchase Price box to provide the asset’s purchase price. Use the Sales Tax box to provide the sales tax percentage that will be charged in addition to the purchase price. Use the Asset Type drop-down list box to identify the asset category. Finally, use the Month Of Purchase box to indi- cate when you’ll purchase the asset. When you’ve provided this information, click Next. Excel displays the second Buy Vs. Lease Wizard dialog box (see Figure 9-10).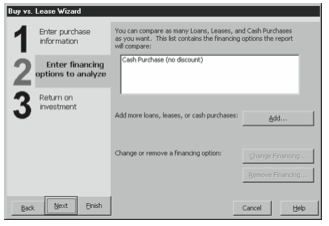
Figure 9-10. The second Buy Vs. Lease Wizard dialog box. - Describe each of the financing alternatives.
Initially the second Buy Vs. Lease Wizard dialog box lists a single financing alterna- tive—that of buying the asset for cash. You can add more financial alternatives by click- ing the Add button and then providing a description of the alternative by clicking buttonsandfillinginboxes.Toaddaloan-financingalternative,forexample,clickAdd. When the wizard asks what kind of financing option you’re adding, click Loan Pur- chase and then click OK. When the wizard displays the Loan Purchase Information dialog box, enter the loan down payment, interest rate, and repayment term informa- tion. To describe other financial alternatives, repeat this process. When you’ve provided information on each of your financing alternatives, click Next. Excel displays the third Buy Vs. Lease Wizard dialog box (see Figure 9-11).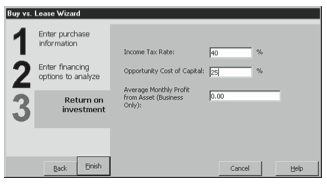
Figure 9-11. The third Buy Vs. Lease Wizard dialog box. Use the third Buy Vs. Lease Wizard dialog box to describe your income tax rate, the cost of capital that the wizard should use in its discounted cash flow calculations, and the aver- age monthly profit of an asset if the asset is one you’ll use for business. Then click Finish.
- Describe each of the financing alternatives.
The Buy Vs. Lease Wizard provides a multi-page report that summarizes the financial effects of the asset purchase under each of your financing alternatives. In addition, the wizard creates a depreciation schedule for a purchased asset and an amortization sched- ule for any loans.
Using the Create Projection Wizard Tool
The Create Projection Wizard tool helps you create a financial projection by inflating or deflating historical accounting data.
To use the Create Projection Wizard tool, follow these steps:
- Start the Create Projection Wizard tool.
Click the Analyze button on the Startup Screen and then choose the Create Projection Wizard item from the list box in the Select A Financial Manager Analysis Tool dialog box and click Next. Excel displays the first Financial Manager Projection Wizard dia- log box (see Figure 9-12).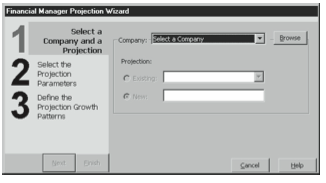
Figure 9-12. The first Financial Manager Projection Wizard dialog box. - Select the company and indicate that you want to create a new projection.
Select the company you want to compare,if necessary, from the Company box. Then click the New button and give a name to your projection using the Name box. When you finish with this, click Next. Excel displays the second Financial Manager Projection Wizard dialog box (see Figure 9-13).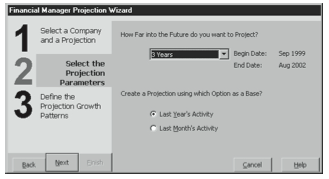
Figure 9-13. The second Financial Manager Projection Wizard dialog box. - Describe the forecasting horizon.
Use the How Far Into The Future Do You Want To Project box to indicate how many months or years into the future you want to project. - Tell the wizard what the projection should be based on.
Use the Last Year’s Activity and Last Month’s Activity option buttons to indicate what data you want to base your projection on. Then click Next. Excel displays the third Fi- nancial Manager Projection Wizard dialog box (see Figure 9-14).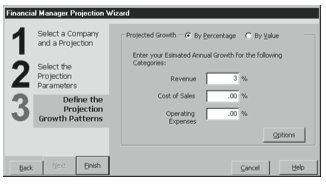
Figure 9-14. The third Financial Manager Projection Wizard dialog box. - Tell the wizard how to change the base values.
Click the By Percentage option button if you want the wizard to inflate or deflate base values by a set percentage. Alternatively, click the By Value option button if you want the wizard to inflate or deflate base values by some stated value. Once you indicate whether you want to change the base values based by a percentage or value, use the Revenue, Cost Of Sales, and Operating Expenses boxes to provide the percentage or value. Click Fin- ish to direct the wizard to create the projection based on your directions.
When the wizard finishes creating your projection, click OK. You can use the Projection Reports tool, which is described in the next section, to view the projection.
Using the Projection Reports Tool
After you create a projection—which is actually just a set of numbers created by the Cre- ate Projection Wizard—you can produce a report based on the projection. To produce such a report, follow these steps:
- Start the Projection Reports tool.
Click the Analyze button on the Startup Screen, and then choose the Projection Reports item from the list box in the Select A Financial Manager Analysis Tool dialog box. Excel displays the first Create A Projection Report dialog box (see Figure 9-15).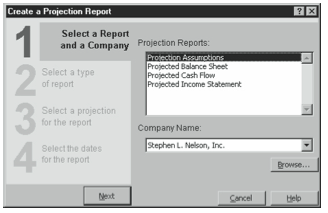
Figure 9-15. The first Create A Projection Report dialog box. - Select a report category.
Select a report category by clicking one of the entries in the Projection Reports list box. - Select the company.
If necessary, select the company you want to compare from the Company box. Then click Next. Excel displays the second Create A Projection Report dialog box (see Figure 9-16).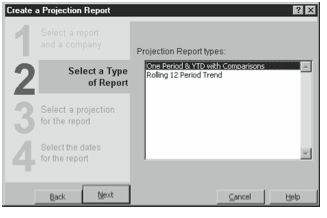
Figure 9-16. The second Projection Reports dialog box. - Select the specific report.
Select the specific type of report you want to prepare by clicking one of the reports listed in the Projection Report Types list box. Then click Next. Excel displays the third Cre- ate A Financial Report dialog box (see Figure 9-17).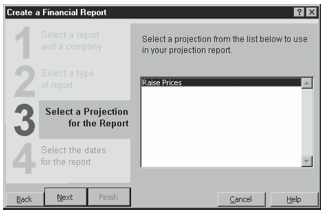
Figure 9-17. The third Create A Financial Report dialog box. - Choose the projection to use.
Select the projection you want to use to create the report by clicking it in the only list box provided by the third Create A Financial Report dialog box. Then click Next. Ex- cel displays the fourth Create A Financial Report dialog box (see Figure 9-18).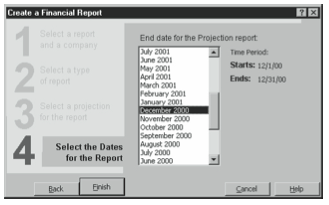
Figure 9-18. The fourth Create A Financial Report dialog box. - Select the specific report.
Select an end date for the projection report by clicking one of the end dates listed on the fourth Create A Financial Report dialog box. Click Finish to direct the wizard to create the projection report using the specified projection.
Excel adds new worksheets to the workbook showing pro forma financial statements based on your projections.
Using the What-If Analysis Tool
The What-If Analysis tool creates a workbook you can use to perform what-if analysis. For example, you can experiment with changing sales or expenses, vendor payment terms and customer financing terms, and bank financing agreements.
Creating a What-If Workbook
To create the what-if analysis workbook, which you’ll use to perform your what-if model- ing, follow these steps:
- Start the What-If Analysis tool.
Click the Analyze button on the Startup Screen, and then choose the What-If Analysis item from the list box in the Select A Financial Manager Analysis Tool dialog box. Excel displays the first Perform A What-If Analysis dialog box (see Figure 9-19).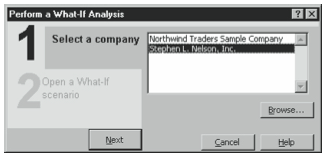
Figure 9-19. The first Perform A What-If Analysis dialog box. - Select the company.
Select the company you want to analyze. When you finish with this, click Next. Excel displays the second Perform a What-If Analysis dialog box (see Figure 9-20).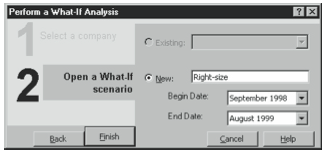
Figure 9-20. The second Perform A What-If Analysis dialog box. - Indicate that you want to create a new what-if analysis.
Click the New option button, and then give a name to your what-if analysis. After you name the what-if analysis, provide begin and end dates for the analysis using the Begin Date and End Date boxes. When you finish with this, click Next. Excel displays the Save As dialog box. - Save the what-if analysis.
Use the Save As dialog box to save your what-if analysis. Use the File Name box to name the new what-if analysis workbook. And use the Save In box to choose a folder location. After you specify the name and location of the what-if analysis, click Save. Excel cre- ates and saves the what-if analysis workbook and displays its overview worksheet (see Figure 9-21).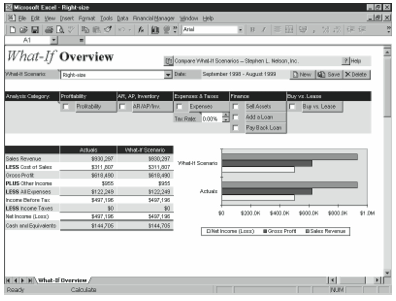
Figure 9-21. The what-if analysis overview worksheet.
Using a What-If Workbook
Once you create the what-if analysis workbook, you use the analysis boxes and buttons to ask your what-if questions.
To ask what-if questions about how sales affect your profitability, for example, click the Profitability button. When Excel displays a dialog box listing the ways that your account- ing data reports sales, select a sales category and click OK. Excel next displays a new worksheet (see Figure 9-22) that lets you see sales by the selected category. To change some number, click the cell and then type your new number. Then to return to the overview worksheet, click the What-If Overview button.
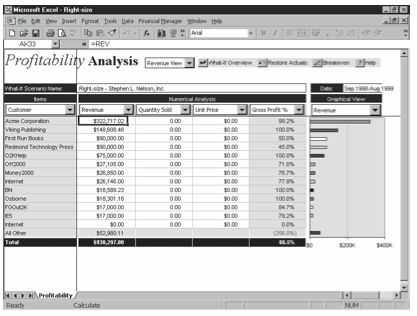
To ask what-if questions about how accounts payable and accounts receivable payment terms and inventory balances affect your cash flow, click the AR/AP/Inv. button. When Excel displays a new worksheet that lets you see accounts receivable, accounts payable, and In- ventory detail, change these asset or liability values by clicking cells and then typing your new numbers. Or, adjust the slider button that corresponds to the item you want to experi- ment with.
To ask what-if questions about how expenses affect your profitability, click the Expenses button. When Excel displays a new worksheet that lets you see expenses by account, change expense values by clicking cells and then typing your new numbers. Or, adjust the slider button that corresponds to an expense.
To create asset purchase and financing what-if scenarios, click one of the Finance buttons or the Buy Vs. Lease button. When Excel displays a dialog box, describe the scenario and click OK.
The what-if analysis overview worksheet provides several other buttons worth mentioning. You can create a new what-if scenario by clicking the New button and then providing a name when prompted. Excel creates the new scenario by using the existing scenarios values, but as you make changes your new scenario evolves. You can display another scenario by choosing it from the drop-down list box in the top-left corner of the overview worksheet. Finally, you can save the workbook by clicking the Save button or delete the workbook by clicking the Delete button.
Using the Chart Wizard
You use the Small Business Financial Manager’s Chart Wizard to create financial charts of your imported accounting data. To use the Chart Wizard, follow these steps:
- Start the Chart Wizard.
You can do this either by choosing the Financial Manager menu’s Chart Wizard com- mand or by clicking the Chart button on the Startup Screen. - Select the category of financial chart you want to create.
To select a financial chart category, click an entry in the Financial Charts list box (see Figure 9-23). After you select a financial chart category, and select the company name if necessary, click Next.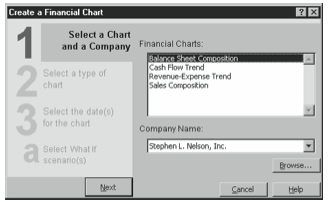
Figure 9-23. The first Create A Financial Chart dialog box. - Select the type of report you want.
When Excel asks what type of chart you want, use the boxes and buttons provided to describe it. Then click Next. - Select an end date for the report.
When Excel asks for the chart end or as-of date, select an entry from the list box. Then click Finish.
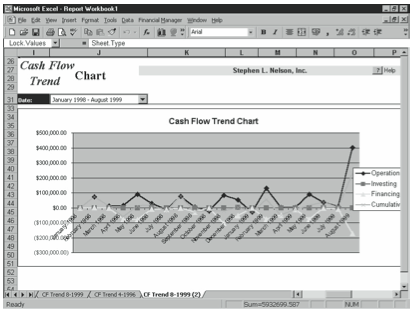
The Chart Wizard creates a financial chart according to your instructions and places the chart on a new sheet in the open workbook. Figure 9-24 shows an example of a financial chart, a cash flow trend chart for January 1998 through August 1999.
Leave a Reply