After you’ve imported your accounting data, you use the Report Wizard to produce a fi- nancial report based on the imported accounting data.
Reviewing the Report Wizard Reports
The Report Wizard produces reports that fall into one of seven categories: balance sheets, cash flow statements, change in stockholders’ equity, income statements, ratios reports, sales analysis reports, and trial balance reports. Table 9-1 briefly summarizes the types of reports that the Report Wizard produces in each of these categories.
| CATEGORY | REPORT OPTIONS AVAILABLE |
| Balance Sheet | Simple balance sheets, balance sheets with prior-year comparisons, and balance sheets with scenarios you’ve created using the what-if analysis tools. |
| Cash Flow | Simple one-period cash flow statements with year-to-date and prior-period comparisons, rolling twelve-period cash flow reports, and one-period cash flow reports and year-to-date cash flow reports with scenarios created using the what-if analysis tools. |
| Change in Stockholders’ Equity | Simple income statements with one-period and year-to-date comparisons, income statements with twelve-period and four-quarter trends, income statements for a fiscal year and periods, income statements for a fiscal year and quarters, and income statements with scenarios created using the what- if analysis tools. |
| Ratios | A rolling twelve-period report showing trends in financial ratios. |
| Sales Analysis | Sales reports from a variety of perspectives, including by customers and by types of services. |
| Trial Balance | Simple trial balance reports with one-period and year-to-date comparisons and trial balance with scenarios created using what-if analysis tools. |
Using the Report Wizard
To use the Report Wizard to create one of its reports, follow these steps:
- Start the Report Wizard.
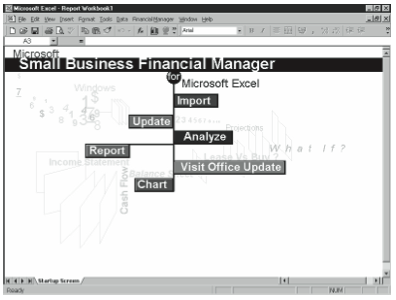
You can do this either by choosing the Financial Manager menu’s Report Wizard com- mand or by clicking the Report button on the Startup screen (see Figure 9-3).
Figure 9-3. The Small Business Financial Manager Startup screen. - Select the category of financial reports you want to create.
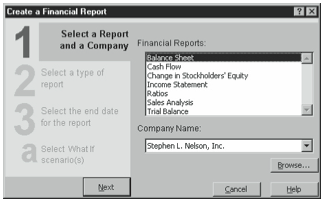
To select a financial report category, click an entry in the Financial Reports list box (see Figure 9-4). After you select a financial report category, click Next.
Figure 9-4. The first Report Wizard dialog box. - Provide the user name and database password.
If Small Business Financial Manager requests it, provide the user name and database password you created during the importation of your accounting data. - Select the type of report you want.
When Excel asks what type of report you want, select an entry from the Report Types list box. Then click Next. - Select an end date for the report.
When Excel asks for the report end date, select an entry from the End Date For This Report list box. Then click Finish.
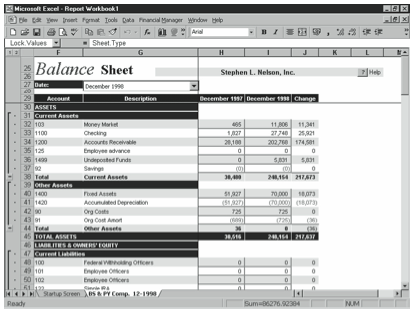
The Report Wizard creates a financial report based on your parameters and places the report on a new worksheet in the open workbook. Figure 9-5 shows an example of one such financial re- port, an income statement for December 1998 with year-to-date and prior-period comparisons.

Using the Report Wizard’s Reports
The principal reason for using the Report Wizard is to generate a report so that you can analyze the report using Excel. This may mean simply viewing the report, perhaps on screen or in a printed copy. If you’re using Small Business Financial Manager in this way, how- ever, you may be doing so only because the reporting capabilities of your accounting soft- ware are very limited or restricting.
The other way you can use the Report Wizard reports, of course, is to use the now-in-a- workbook financial data for making your own calculations. This work is something you can’t do with your accounting program’s reports. Once you’ve got a report stored in an Excel workbook, it’s relatively easy to create formulas that manipulate the data, extract informa- tion so it can be analyzed, and chart information so it can be visually analyzed or shared. This type of work requires the basic Excel skills discussed in Chapters 2 and 3.
Leave a Reply